Measure how good each team is
One Trillion Brackets is built on my simulation engine, SAMSIM, which runs Monte Carlo simulations using strength scores from KenPom. Every team gets a single number that captures how strong they are. KenPom factors in offense, defense, pace, strength of schedule, and home/away performance. I am grateful to Ken Pomeroy for his long history of incredible work.
Turn strength into win probability
KenPom gives each team two key numbers: an Adjusted Efficiency Margin (AdjEM), which captures overall strength, and an Adjusted Tempo (AdjT), which measures how many possessions a team plays per game.
AdjEM is calculated per 100 possessions, but real games don't have exactly 100 possessions. Some teams play fast, others slow. So we scale the efficiency margin difference by the teams' combined tempos to get a predicted point spread—how many points we expect Team A to beat Team B by.
But a point spread isn't a probability. Saying "Team A should win by 5.4 points" doesn't tell us how likely they are to actually win. College basketball is noisy—a team favored by 5.4 points might win by 25 or lose by 5. Luckily, this variance follows a bell curve. The typical deviation of a college basketball game is about 11 points from the predicted margin.
So we take the predicted spread and divide by 11 to get a z-score—a way of asking "how big is this gap compared to the normal randomness of a college basketball game?" A z-score of zero is a coin flip. The further from zero, the more one-sided the matchup.
then
P(A wins) = Φ(z)
- 1-seed vs 16-seed (large z-score): ~99%
- 5-seed vs 12-seed (moderate z-score): ~60-65%
- 8-seed vs 9-seed (z ≈ 0): ~50/50 (9 seeds have won more games across the last 39 tournaments)
Sports betting odds for Round 1
For the first round, I can do better than KenPom alone. Sportsbooks set lines for every known matchup, and sophisticated bettors move those lines with their own models. The result is the wisdom of the market. It takes into account every sharp bettor's model and out comes a more reliable probability.
By scraping money lines before tip-off, I get instant probabilities for all 32 first-round games that reflect far more information than any single model. For example, if Vegas sets a 6-seed vs 11-seed at −200/+200, that implies a 67%/33% split.
Since betting lines only exist for known matchups, I use them for Round 1 (32 games) and KenPom for Rounds 2–6 (31 games), where matchups aren't known in advance.
Step 3Simulating 63 games
For each game, SAMSIM generates a random number between 0 and 1. If it's less than the win probability, the favorite wins. Otherwise, upset.
1Each game: Calculate win probability from strength scores
For a 67% favorite, a random number of 0.39 would select the favorite because 0.39 < 0.67
2Advance winners to the next round
Recalculate probabilities for next round. 63 games total, each using the same formula
Early upsets may cascade. If a 12-seed beats a 5-seed, that 12-seed now faces different opponents with different odds. One upset can completely reshape an entire region.
Step 4Repeat one trillion times
Same probabilities, different random numbers each time. An 80% favorite still loses 20% of simulations. Run it a trillion times and you get (almost) a trillion different outcomes.
Each bracket is 63 binary outcomes (win/loss), which fits in 63 bits. I store each bracket as a single 64-bit integer—8 bytes per bracket, ~8 terabytes total.
Parallel processing
Numba JIT compiler across multiple CPU cores. Millions of brackets per second.
Sharded storage
Split into 8 GB files for parallel writes and cloud storage.
Bit encoding
Each bracket = one 64-bit integer. Bit position = game outcome.
For 2025 it is possible to simulate how the tournament would have evolved with 1 trillion brackets. Going game by game with the probabilities determined by SAMSIM, it can be determined how many brackets would theoretically remain after each game:
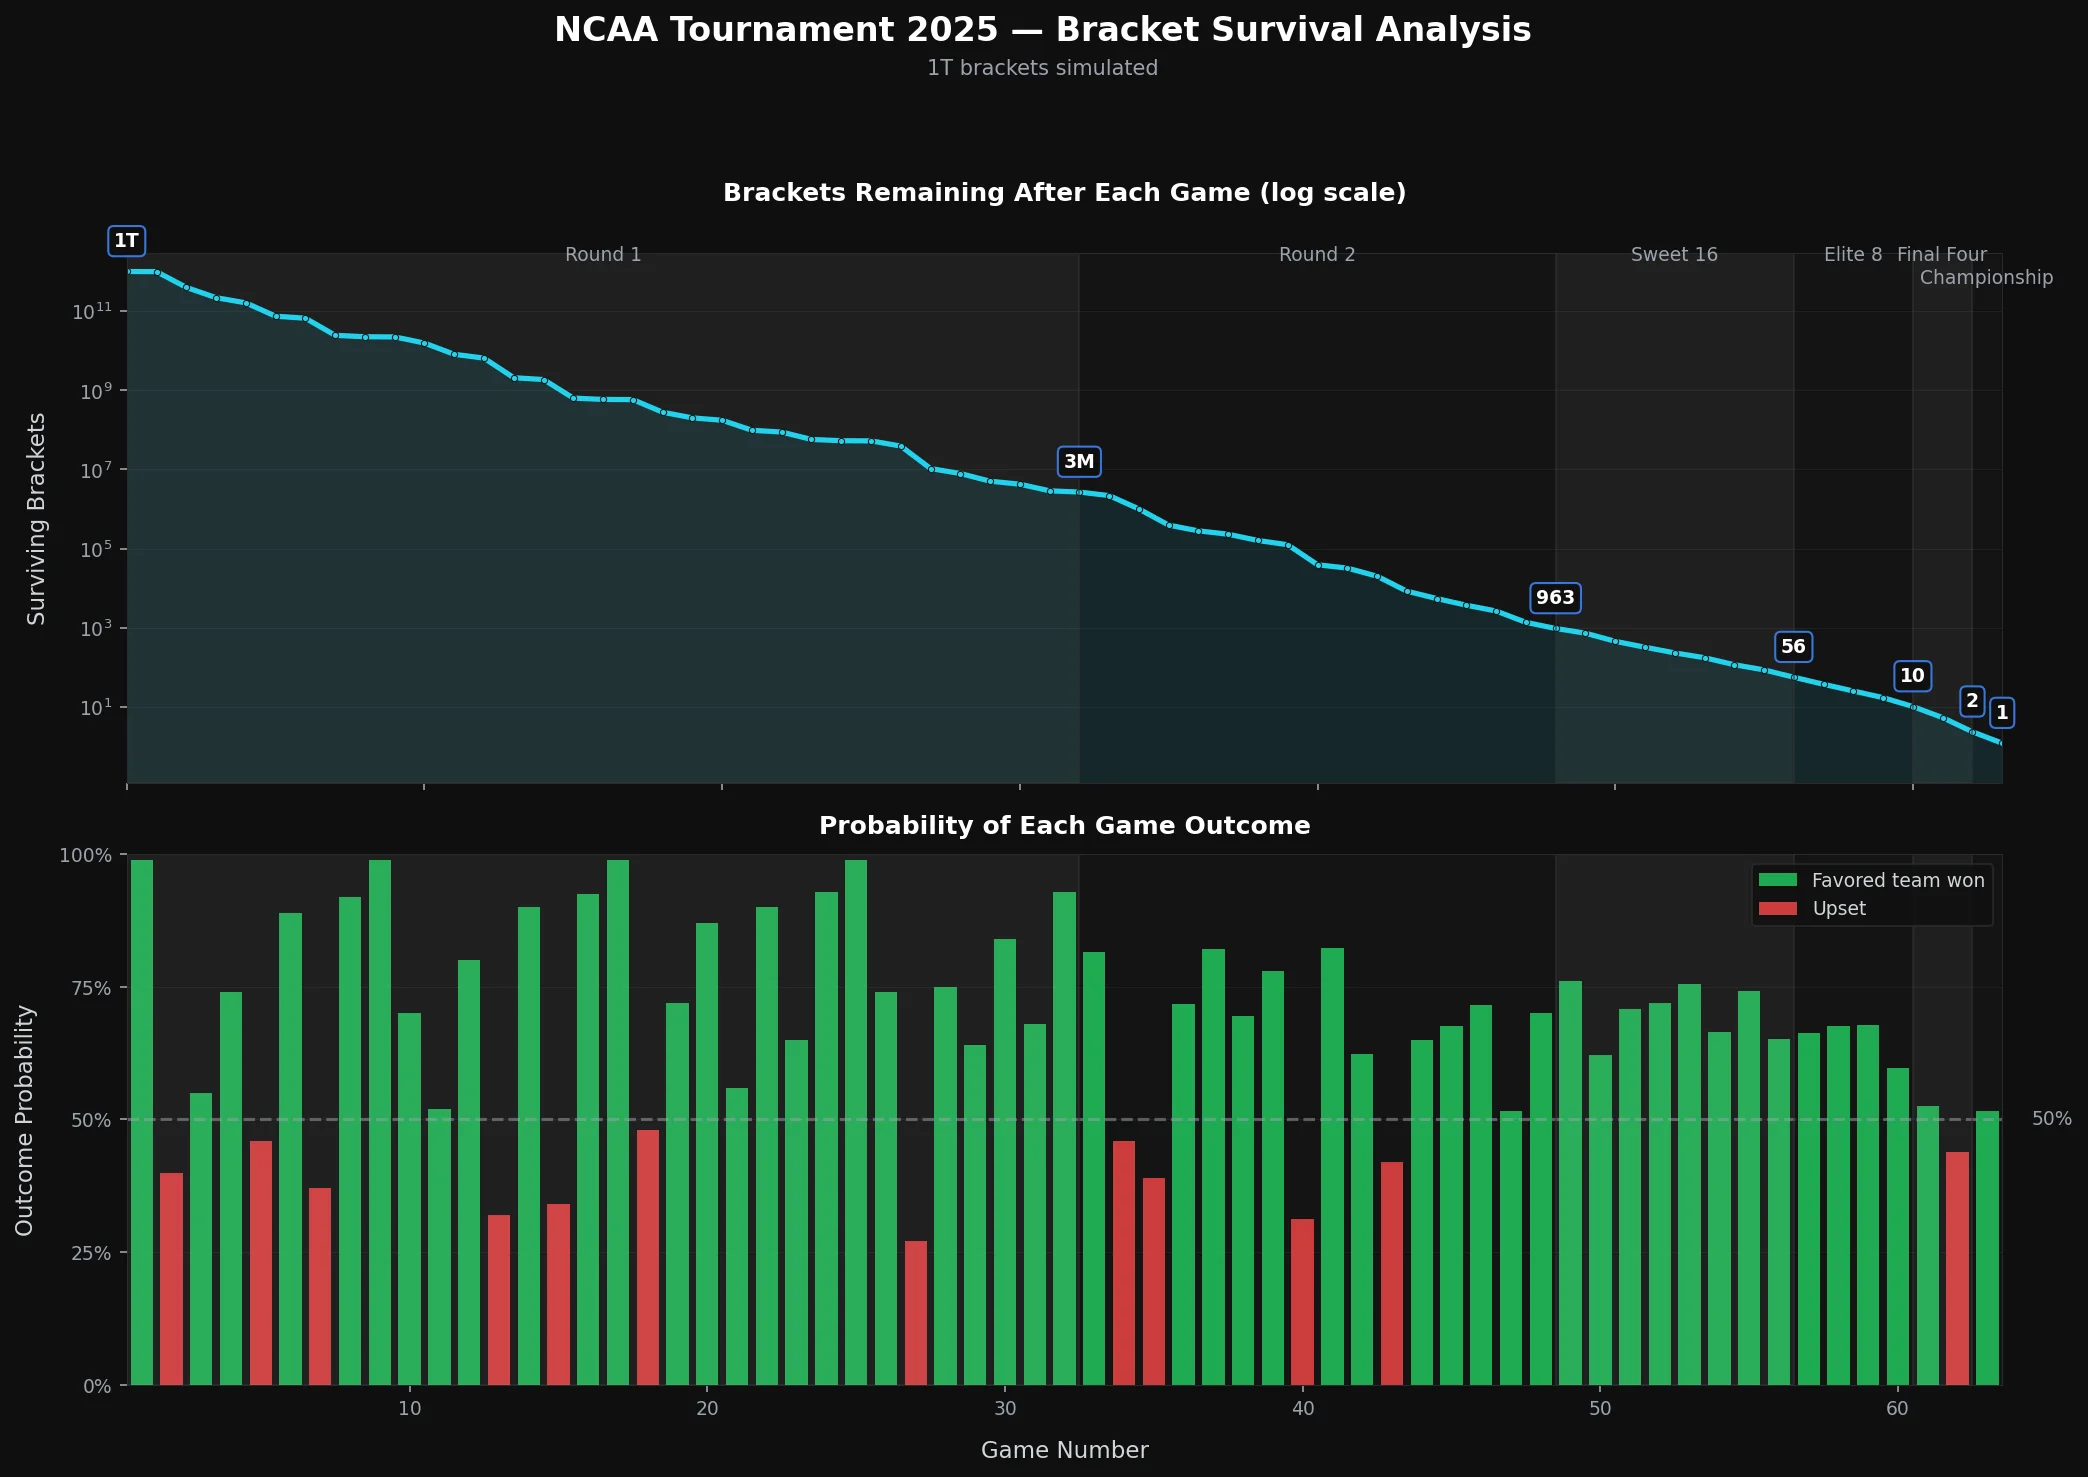
Notice the y-axis is logarithmic. Theoretically, one bracket (actually 1.4 brackets) should remain at the end of the tournament. Lucky enough, SAMSIM actually hit it in under 400 billion simulations.
You should also notice how many green bars there are, representing a favorite winning the game. Compare this to 2021:
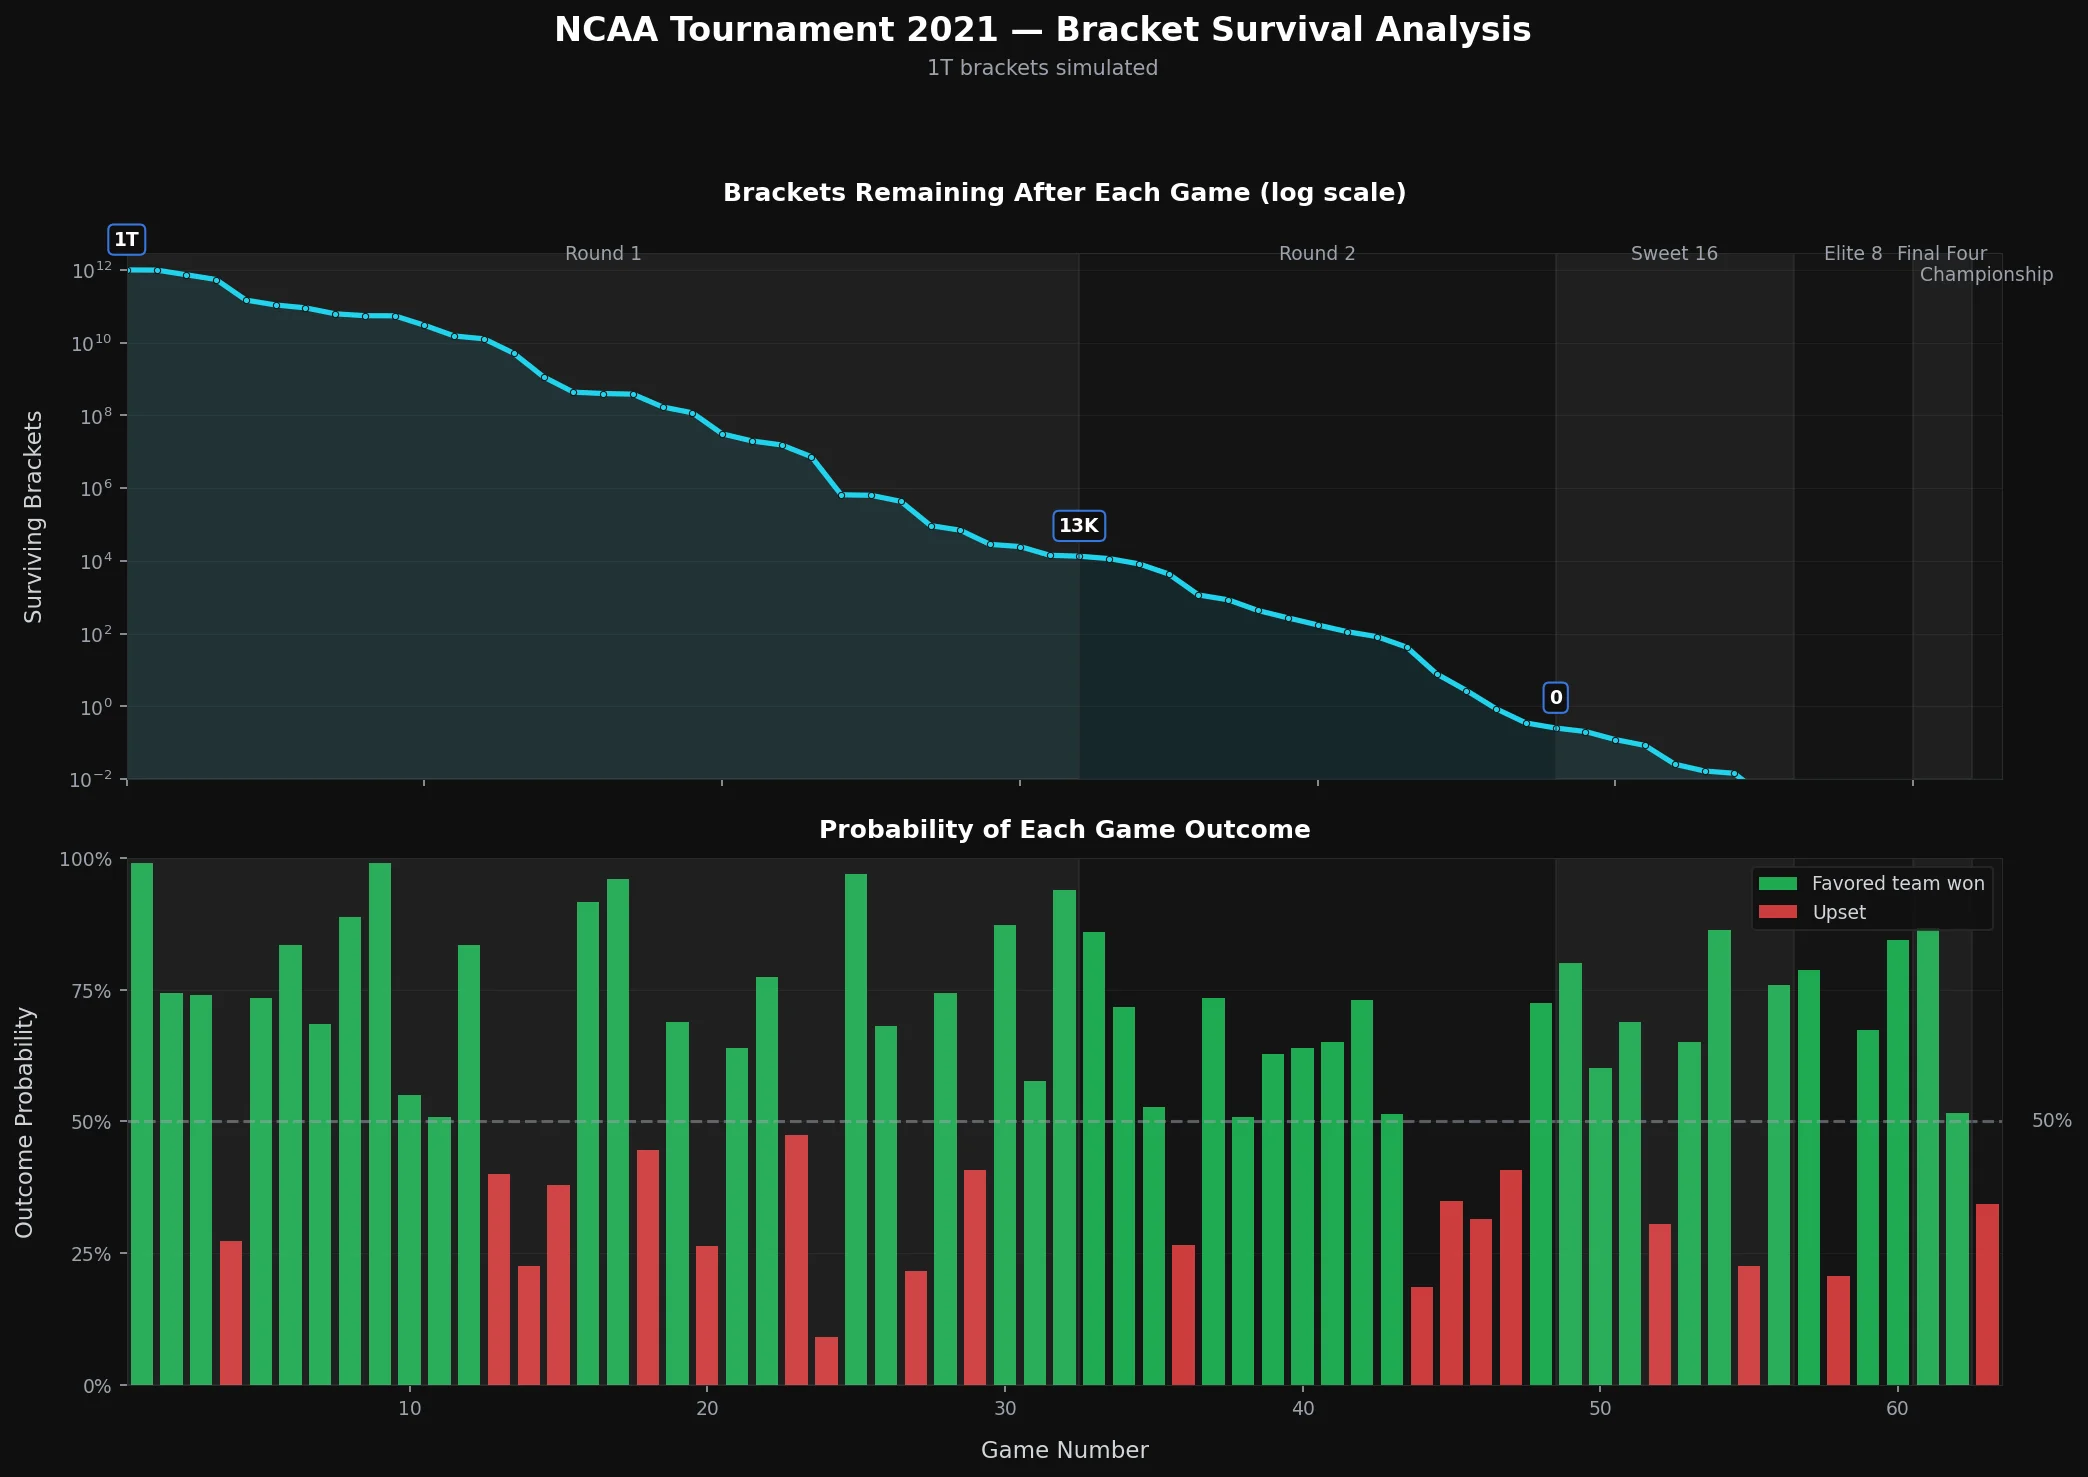
That's several more red bars, and some of them are very small; these represent intense upsets, and as a result, there are just 13K brackets remaining after round 1 instead of 3 million, as there are in the chart for 2025. For a year like 2021, I wouldn't even make it through the second round with 1 trillion brackets!
Step 5Prove they existed before tip-off
Using cryptography, I can prove that all of the brackets existed in my dataset before the tournament begins. Shortly after Selection Sunday, I generate the trillion brackets, then publish the Merkle root hash on the Bitcoin blockchain. This hash proves that all of the brackets existed before tip-off. If, say, bracket #123456789 is found to be the best bracket in my dataset, I can publish a much smaller sample of my brackets, and it can be verified that the bracket existed before tip-off. This means I don't need to transfer all ~8TB of data to everybody that wants to confirm I have not cheated.
This method is called a Merkle tree. The trillion brackets get chunked, hashed, and combined into a single "root" hash. Change one bit in one bracket anywhere in the dataset, and the root hash changes completely.
Want to understand verification in more detail?
Verification Docs →Most of these brackets are doo doo stinky trash garbage
Random sampling means you get a lot of junk. More than 1 million brackets will have a 16-seed in the championship as a result of random sampling and massive scale. The trillion includes any weird outcome the probabilities allow.
Testing on the past 10 tournaments: half the time, none of my brackets survived past the second round. In 2021, my best bracket got only 44 straight, which is five games short of the all-time record, despite making 500× more brackets than humans have ever created. This means that before the end of Round 2- just 4 days after the tournament begins- all trillion brackets may be busted. Getting it perfect is incredibly difficult.
But in a chalk year like 2025, where all four 1-seeds made the Final Four? I hit a perfect bracket in under 400 billion tries. The simulations work when the tournament cooperates.